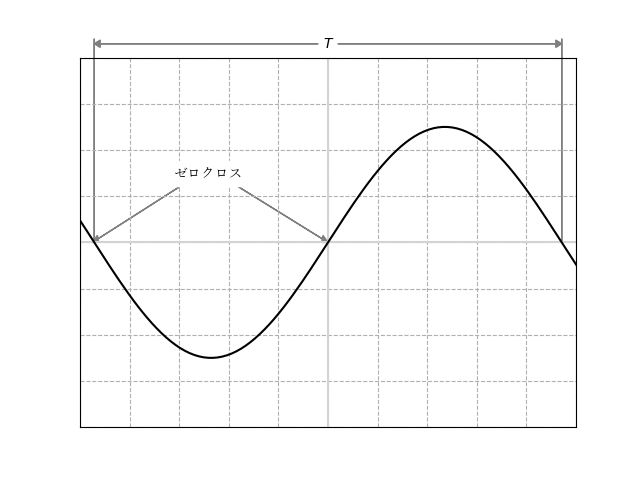
周期と周波数の関係を測定します.
import numpy as np
import matplotlib.pyplot as plt

plt.rcParams['font.family'] ='Yu Mincho'

x = np.linspace(-np.pi*2, np.pi*2, 200)

fig = plt.figure()
ax = fig.add_subplot(1, 1, 1)

plt.xticks(np.arange(-5, 6, 1), c='None')
plt.yticks(c='None')
plt.xlim(-5, 5)
plt.ylim(-2.0, 2.0)
plt.grid(ls='--')
plt.axhline(0, c='lightgray')
plt.axvline(0, c='lightgray')
plt.tick_params(length=0)
plt.plot(x*1.5, np.sin(x)*1.25, c='k', ls='-')

ax.arrow(-1.8, 0.6,   1.8, -0.6, head_width=0.08, length_includes_head=True, color='gray', clip_on=False)
ax.arrow(-3,   0.6, -1.75, -0.6, head_width=0.08, length_includes_head=True, color='gray', clip_on=False)
ax.text(-3.1, 0.7, 'ゼロクロス', fontsize=10, backgroundcolor='w')

x15 = np.pi*1.5
ax.arrow( x15, 0, 0, 2.2, color='gray', clip_on=False)
ax.arrow(-x15, 0, 0, 2.2, color='gray', clip_on=False)
ax.arrow( 0.2, 2.15,  x15-0.2, 0, head_width=0.08, length_includes_head=True, color='gray', clip_on=False)
ax.arrow(-0.2, 2.15, -x15+0.2, 0, head_width=0.08, length_includes_head=True, color='gray', clip_on=False)
ax.text(-0.1, 2.1, '$\it{T}$')

plt.show()