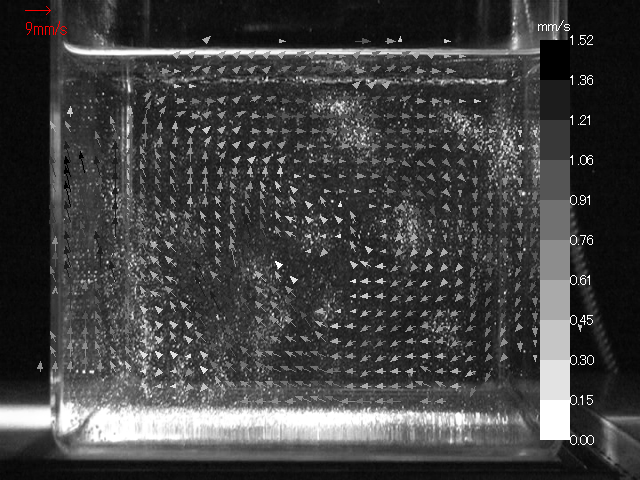
舞鶴高専の4年生,機械工学実験のテーマの1つに『自然対流の可視化とPIV計測』という実験があります.
以下のような解析結果を出しますが,PCの老朽化に伴う機種更新の検討過程で,フリーな環境でもPIV計測できる可能性を発見したので,ここに公開します.

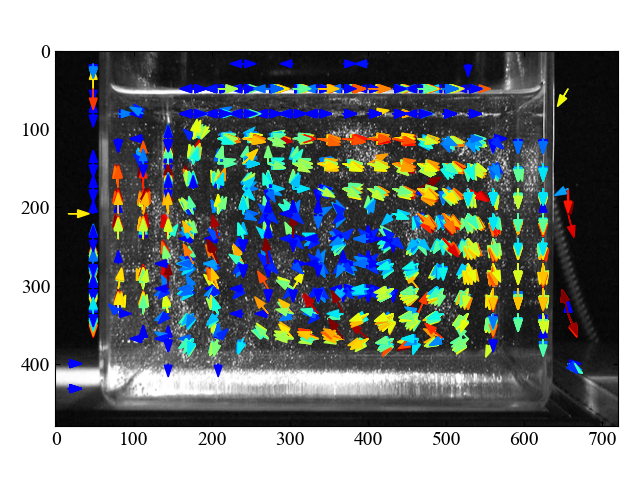
オリジナルは WATLABブログ さんの Python/OpenCVでPIV計測!粒子移動をベクトル化する を参考にさせてもらいました.先人の知恵に感謝! また,ここで紹介するコードは GitHub にて公開しています. opencv-python, numpy, matplotlib の各ライブラリを使用するのでインストールしておいてください.
import os
import argparse
import cv2
import numpy as np

## 使い方
## py avislice.py -h

def m_slice(path, out, step):
    movie = cv2.VideoCapture(path)                  # 動画の読み込み
    Fs = int(movie.get(cv2.CAP_PROP_FRAME_COUNT))   # 動画の全フレーム数を計算
    ext_index = np.arange(0, Fs, step)              # 静止画を抽出する間隔

    for i in range(Fs - 1):                         # フレームサイズ分のループを回す
        flag, frame = movie.read()                  # 動画から1フレーム読み込む
        check = i == ext_index                      # 現在のフレーム番号iが、抽出する指標番号と一致するかチェックする

        # frameを取得できた(flag=True)時だけ処理を行う
        if flag:    # == True
            # もしi番目のフレームが静止画を抽出するものであれば、ファイル名を付けて保存する
            if True in check:
                # ファイル名は後でフォルダ内で名前でソートした時に連番になるようにする
                path_out = out + '\\' + str(i).zfill(5) + '.png'
                print(path_out)
                cv2.imwrite(path_out, frame)
    return

# 引数処理
parser = argparse.ArgumentParser(description='動画ファイルから静止画を出力します.')
parser.add_argument('inFile', help='分割したい動画ファイル名.漢字を含むフォルダやファイル名はやめておきましょう.')
parser.add_argument('-o', '--outFolder', help='出力フォルダ.省略すると動画ファイル名と同じフォルダが作られます.')
parser.add_argument('-s', '--split', type=int, default=10, help='動画スキップ数.')
args = parser.parse_args()

if not args.outFolder:
    args.outFolder = os.path.splitext(os.path.basename(args.inFile))[0]
if not os.path.exists(args.outFolder):
    os.mkdir(args.outFolder)

# 関数実行:引数=(ファイル名のパス、保存先のフォルダパス、静止画拡張子、ステップ数)
m_slice(args.inFile, args.outFolder, args.split)
たとえば py avislice.py sample\s0.avi のように実行すると,s0 というフォルダに連続静止画(png)を出力します. どれくらいの動画フレームで出力するかは '-s' オプションで指示します. py avislice.py sample\s0.avi -s 1 とすると,1フレームずつ出力されます.デフォルトは 10 です.
import cv2
import os
import argparse
import glob
import numpy as np
from matplotlib import pyplot as plt

## PIV解析をする関数
## 使い方
## py piv.py -h

def piv(dir, out, threshold, wsize=32, overlap=0):
    count = 0
    path_list = sorted(glob.glob(os.path.join(*[dir, '*'])))  # ファイルパスをソートしてリストする

    # グラフ初期化
    plt.rcParams['font.size'] = 14              # フォントの種類とサイズを設定する。
    plt.rcParams['font.family'] = 'Times New Roman'
    plt.rcParams['xtick.direction'] = 'in'      # 目盛を内側にする。
    plt.rcParams['ytick.direction'] = 'in'
    # グラフの上下左右に目盛線を付ける。
    fig = plt.figure()
    ax1 = fig.add_subplot(111)
    ax1.yaxis.set_ticks_position('both')
    ax1.xaxis.set_ticks_position('both')
    # 背景画像の用意と表示設定
    img = cv2.imread(path_list[0], 0)       # 最初の画像を背景画像とする
    ax1.imshow(img, cmap='gray')            # 背景画像
    cm = plt.get_cmap('jet')                # カラーマップ
    vsf = 2                                 # ベクトル表示のスケールファクタ

    # 全画像ファイルをリストしてPIV計算を実施
    for i in range(len(path_list)-1):
        count += 1
        vectors_amps = []                                     # ベクトルの大きさ情報を格納する空配列
        coordinates = []                                      # 座標情報を格納する空配列
        correlation_coef = []                                 # 相関係数情報を格納する空配列

        # グレースケール画像で2枚(i, i+1)の画像を読み込み
        img1 = cv2.imread(path_list[i], 0)
        img2 = cv2.imread(path_list[i+1], 0)

        # 画像サイズを取得
        h, w = img1.shape
        h2, w2 = img2.shape

        # ファイルサイズが揃っていない場合はエラー
        if h != h2 or w != w2:
            print('Error:img(i).shape != img(i+1).shape.')
            print('Align image size.')
            break

        w_st = int(w / (wsize - overlap))                     # 幅のストライドを計算
        h_st = int(h / (wsize - overlap))                     # 高さのストライドを計算

        # 画像を走査しながら処理をする(h_st, w_stのサイズでループ)
        for k in range(h_st-1):
            for j in range(w_st-1):
                # テンプレートマッチング部分-------------------------------------------------------------
                # 抽出範囲の点(左上、右上)を計算
                p_h1 = k * (wsize - overlap)
                p_h2 = p_h1 + wsize
                p_w1 = j * (wsize - overlap)
                p_w2 = p_w1 + wsize

                # パターンマッチングから移動先座標を計算
                template = img1[p_h1:p_h2, p_w1:p_w2]                    # img[i]からテンプレート画像を抽出
                method = cv2.TM_CCOEFF_NORMED                            # NCC(正規化相互相関係数)を選択
                res = cv2.matchTemplate(img2, template, method)          # img[i+1]に対するテンプレートマッチングの結果
                min_val, max_val, min_loc, max_loc = cv2.minMaxLoc(res)  # 最小値と最大値、その位置を取得

                # テンプレート画像の中心座標を計算
                before_w = int(p_w1 + (p_w2 - p_w1) / 2)                 # 探査前のx座標
                before_h = int(p_h1 + (p_h2 - p_h1) / 2)                 # 探査前のy座標
                after_w = int(max_loc[0] + wsize / 2)                    # 探査後のx座標
                after_h = int(max_loc[1] + wsize / 2)                    # 探査後のy座標

                # 評価指標を計算
                dx = after_w - before_w                                  # x増分値
                dy = after_h - before_h                                  # y増分値
                vector_amp = np.sqrt(dx ** 2 + dy ** 2)                  # ベクトルの大きさ
                coordinate = [before_w, before_h, dx, dy]                # 座標と増分値セット

                # データ格納
                vectors_amps.append(vector_amp)
                coordinates.append(coordinate)
                correlation_coef.append(max_val)
                # ----------------------------------------------------------------------------------

        # ここからグラフ描画-------------------------------------

        # 誤ベクトル処理(一度に一定ピクセル(threshold)以上のベクトルは長さを0にする)
        for m in range(len(vectors_amps)):
#            print(m, '/', len(vectors_amps)-1)
            if vectors_amps[m] >= threshold:
                coordinates[m][2] = 0
                coordinates[m][3] = 0
                vectors_amps[m] = 0

        # 誤ベクトル処理後のベクトルをMin-Max正規化(cmapでベクトルに色を付けるためだけの変数)
        norm_vectors = (vectors_amps - np.min(vectors_amps)) / (np.max(vectors_amps) - np.min(vectors_amps))

        # 画像にベクトルをプロットする
        for n in range(len(vectors_amps)):
#            print(n, '/', len(vectors_amps)-1)          # 進捗表示
            # 長さ0以外の場合に図にベクトル(dx, dyにそれぞれスケールを乗じた後のベクトル)を描画
            if vectors_amps[n]:     # != 0
                ax1.arrow(x=coordinates[n][0], y=coordinates[n][1],
                          dx=vsf * coordinates[n][2], dy=vsf * coordinates[n][3],
                          width=0.01, head_width=10, color=cm(norm_vectors[n]))

        # 画像作成の進捗を表示
        print(count, '/', len(path_list) - 1)

    # レイアウトタイト設定
    fig.tight_layout()
    plt.savefig(out)

    return

# 引数処理
parser = argparse.ArgumentParser(description='連続静止画からPIV可視化を行います.')
parser.add_argument('inFolder', help='連続静止画が保存されているフォルダ名.漢字を含むフォルダやファイル名はやめておきましょう.')
parser.add_argument('-o', '--outFile', help='出力フォルダ.省略すると入力フォルダ名と同じ名前のpngファイルに出力されます.')
parser.add_argument('-t', '--threshold', default=10, type=int, help='誤ベクトルのしきい値.デフォルト=10')
args = parser.parse_args()

if not args.outFile:
    args.outFile = os.path.splitext(os.path.basename(args.inFolder))[0] + '.png'

# PIV解析の関数を実行
piv(args.inFolder, args.outFile, args.threshold)
たとえば py piv.py s0 のように実行すると,s0フォルダにある連続静止画から s0.png というPIV解析結果の画像ファイルを出力します.

市販のPIV計測ソフト(Flow-vec)が50マン円ですからね~ すごい時代になりました.